Trying to Close the Gaps in Care
HEDIS may be unfamiliar to most patients and the general public, but to clinicians, it’s as common a term as co-pay or managed care. It may not be wildly popular (some rural physicians have been quoted as saying “HEDIS schmedis”), but it’s an inescapable part of the medical landscape. It’s the most widely used quality improvement tool in healthcare: More than 90 percent of managed care plans use HEDIS to collect data on how their physicians perform in more than 90 areas of healthcare service and delivery, and the National Committee on Quality Assurance (NCQA) collects HEDIS data on health plans covering 81 percent of all people with health insurance. All in all, 190 million people are enrolled in plans that collect HEDIS data.
Consider “HEDIS Is the Hassle That Became a Habit” — the headline of an article in Managed Care magazine a few years ago. The author, contributing editor Joseph Burns, explained that the quality improvement tool came into being 25 years ago due to concerns that insurers’ fixed monthly payments to physicians and hospitals on behalf of their enrollees might lower the incentive to provide high-quality care for American workers and their families — and in fact might serve as an incentive for poor-quality care.
To ensure that didn’t happen, the government decided to roll out a performance measurement tool for managed care health plans — later renamed the Healthcare Effectiveness Data and Information Set (HEDIS). It tracks everything from how many patients are getting immunizations on schedule to how many eligible patients are screened for breast cancer and colorectal cancer, getting their diabetes A1C check, or keeping their blood pressure under control.
As Burns explained in an aside on the origins of the country’s oldest and most important quality improvement system, “American health care has never met an acronym it didn’t like, so that long name got shortened to HEDIS, which is pronounced HEE-dis. To some ears that sounds more like an infectious disease than a quality improvement tool…and [some] providers tend to view it as, at best, a bother.”
Many other doctors have gotten used to it over the years, he added, and are using it to provide value-based care. However, the paperwork involved and the tool’s lack of alignment on quality measure systems mean HEDIS’s “hassle” factor is often still overwhelming.
CHCN was well-acquainted with the hassle factor, but its goal was to better track gaps in HEDIS’s quality measures for health care — and fix them. For example, if a patient at risk for diabetes was due for an A1C blood test for blood glucose, how could the health centers make sure that happened when she came in for a checkup?
To be proactive in finding patients who needed appropriate tests and care, the clinic managers, providers, QI staff, care coordinators and community health workers had to dig through patient charts across multiple systems, Clinic employees involved in tracking — which included providers, clinic manager, quality improvement team, and care coordinators — also had to develop independent “shadow” tracking systems for each HEDIS measure.
“HEDIS has many measures, and for each measure you need different information — sometimes exams, sometimes lab results — and you need to jump between different sources,” says Yin-Yu Chen, quality management (QM) data analyst at CHCN. “And you need to jump between different sources to find the data. Before Tableau, just looking at one patient, you might need to comb through 10 different spreadsheets to figure out if we were compliant.”
In addition, providers were rarely prepped or aware of HEDIS gaps in care before or during a patient’s visit, so they often lost the opportunity to prescribe the corrective screenings or care during a visit.

Getting Data in Real Time

A key issue is that the health centers were not receiving up-to-date, real-time data from CHCN, which was especially troubling because the health centers’ Pay for Performance scores were based on HEDIS scores – the ones reported after CHCN’s annual audit.
“Real-time data analytics for HEDIS measures from CHCN were not available across the clinics,” recalls CHCN Provider Services Coordinator Rosie Chu. “Our data analytics team would conduct an annual Quality Improvement Audit, but they weren’t able to provide up-to-date reporting for the clinic teams.”
The head of the data team also recalls the earlier reports as an exercise in frustration. “Before Tableau, CHCN’s reports were not actionable,” says Xiao Chen, director of the network’s analytics. “Our team would also distribute monthly reports, and the clinic staff would say, ‘This isn’t current.’ Our annual Quality Improvement Audit was difficult to turn into meaningful next steps because of the time frame.” The relay of data between the data analytics team and the health centers, the data team found, was just too slow to make a difference in the health centers’ programming and operations.
To make things more complicated, each health center used a different tracking strategy to identify gaps in care. The inefficiencies led to many patients losing out on follow-up visits or missing the recommended screenings or treatments, thus further whittling away at the HEDIS scores.
In 2015, CHCN chose Tableau as its vendor for data visualization software. With Tableau’s help, CHCN planned to unify its HEDIS measurements so no clinic had to track its scores independently. The first step would be to figure out how to use Tableau to produce the best HEDIS data reports in real time.

Getting Buy-In
CHCN was convinced that its strong quality improvement and analytics team — armed with HEDIS software — could create a QI performance tool that would help its health centers do timely outreach and follow-up with patients to ensure high quality care. But CHCN first had to develop independent data sharing agreements with each health center. That way, CHCN analysts could pull the Tableau patient data from the centers’ electronic health record (EHR) and push it into the Tableau software to create their analytics dashboard.
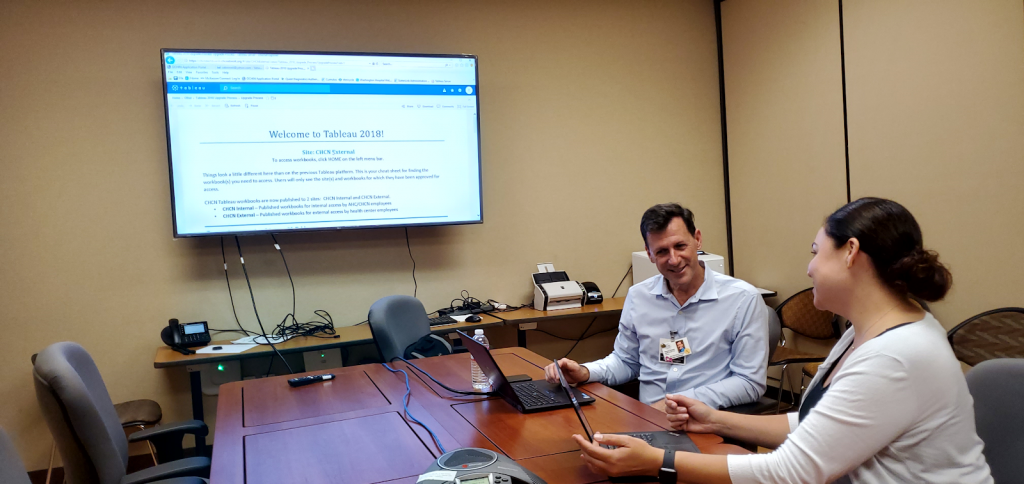
Seeking out and incorporating end-user feedback into the design of the Tableau reports was key to the project’s launch, according to Chu. At the demonstrations, clinic leaders and various staffers would study the reports and offer suggestions, so that subsequent Tableau reports were better tailored to their needs.
“We had meetings with them monthly, not only on HEDIS, but also other projects,” says Chen. “In the meetings we’d discuss HEDIS Tableau functions, best practices, and what the team was looking for. For example, the QI representatives noted that they were looking at data for the entire center — a center that might have up to 10 clinics in different locations, with each having different workflows. So we created new filters in which you could easily display the information on patients by clinic location.”
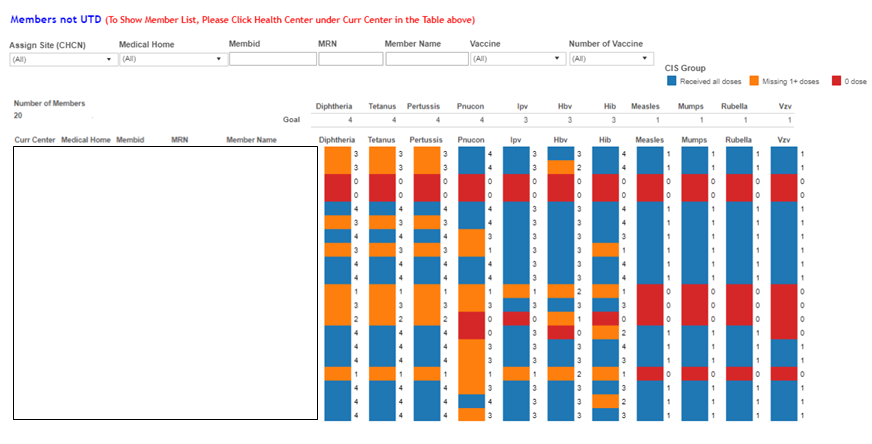
Other user feedback was about how difficult it was to tell whether a child up to 3 years old had had all his or her immunizations (sometimes each vaccination had to be repeated several times). The data team then color-coded the results by blue (for someone who was up to date on their immunizations), orange (for someone missing even one booster shot), and red (for someone who had no immunizations). “If you put too many colors in there, it could be too confusing,” says Chen. “But the color charts made the data easy to use.”

The first data-sharing agreement was signed in the first quarter of 2016, and by the third quarter of 2017 all eight clinics had signed the agreements. Once clinic leadership, providers, and quality improvement staff saw the effectiveness of the HEDIS/Gaps in Care reports, initially skeptical leaders became enthusiastic over the idea of real-time HEDIS surveys.

Each data sharing agreement with a health center was a successful benchmark and allowed the data analytics team to build reports that were more robust, comprehensive and actionable.
“Tableau gives you the freedom to create narratives from large pools of data,” says Yin-Yu Chen. “[But] Tableau didn’t help us build the reports — you just get the software on your computer and the rest is your job.”
Users can filter by HEDIS measurement to see how well-aligned their clinic is with its goals. For the goal of doing a primary care check-up once a year, for example, they can find out current members without primary care visits within 365 days; specialist utilization by specialty, location and provider; current members with ER visits within 365 days; and current members with inpatient visits within 7 days.
A checkbox also allows users to apply one or more pre-defined criteria to data set (i.e. Yes-No, filter by site); users can also filter by HEDIS measurement. Users can also email CHCN data analysts with any questions, comments or suggestions or link to a series of reference guides and FAQs.
Health center providers and managers embraced the real-time reports.
“With the HEDIS/Gap in Care report, I’m able to see which patients have gaps and filter for patients coming in for a visit within the next 10 days,” says Roy Coleman, clinical operations manager at the Tiburcio Vásquez Health Center. “This allows us to go into their EHR and prep the patient’s chart so when they arrive, everything is set up – an A1C test, their next PAP appointment, whatever is needed. It prompts the provider and the front desk staff to take care of the patient’s gaps in care while we have them in the clinic.”
Meanwhile, the CHCN data analytics team continued to work hard to refine the reports to make them as useful and as accessible as possible.
“We consistently seek feedback from our end users about what would be most useful to them and design our reports accordingly,” says Jennifer Du Mond, CHCN senior data analyst. “We recently did this with a report for colorectal cancer screening. The clinics requested a way to identify who would be due for re-testing soon, not just those who were already overdue, as well as metrics to keep track of “missed opportunities” – people who were due for screening and had an appointment but did not get a screening test ordered.
“With their feedback, we developed new functionality in an existing report, one of our clinics was able to bring their screening rate up by 8 percent and exceed their screening goal, which they had been lagging on by 4 percent prior to the introduction of the new features.”
 The Community Health Center Network (CHCN) — a network of eight federally qualified health centers — oversees safety net services to 140,000 Medi-Cal patients in California’s Alameda and Contra Costa counties. It does business administration for the centers’ high-quality affordable care to underserved populations, including Latinos, African Americans, Asians and Native Americans. It’s a technology innovation hub. And on top of everything else, CHCN is working furiously to boost the health centers’ HEDIS ratings — a set of quality improvement measures that can translate into better patient health as well as financial rewards.


