Suddenly, we are awash in data. From individual lab results to health system finances, healthcare organizations are looking for ways to turn the huge volumes of information they have into useful knowledge. Supported by CCI’s Innovation Center for the Safety Net program, San Mateo Medical Center worked with data science startup Lumiata to pilot their Snowflake platform. Snowflake provides predictive and prescriptive analytics that can both map an individual patient’s likely outcomes and identify population-level gaps in care.
Seeing the Possibilities
With electronic health records (EHRs) becoming the norm, we are now recording minute health details about millions of patients. As EHR systems knit together and begin to store their information in a way that is sortable and searchable, new possibilities are unfolding. What can we do with all this data? Organizations can use it to understand the impacts of specific interventions, or the effectiveness of specific providers, or sniff out environmental and social factors causing health trends in their populations. With the right tools, researchers can even crunch numbers about millions of patients to better learn how various health conditions are linked—to the point that software could even be used to predict an individual patient’s outcomes by comparing their symptoms and medical data to similar patients. Such a personalized prediction could be more effective than impersonal studies at helping patients understand their health, and motivating them to make better lifestyle choices.
Mapping a Doctor’s Mind
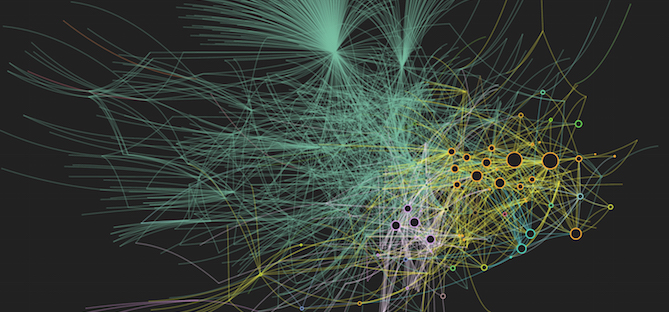
Data science company Lumiata describes their Snowflake platform as “a medical graph.” This graph combines data science and medicine to connect health data with medical knowledge and clinical practice. It is is able to predict the current and future health status of a patient or population. This computational framework seeks to mimic how physicians think by analyzing the connections and causalities, empirical and probabilistic, that human physicians are taught about in medical school. More than decision support, Snowflake applies a physician’s chains of reasoning to identify optimal patient care at a personalized individual level.
This graph organizes and analyzes hundreds of millions of data points in virtual real-time, and is curated by over 25,000 physician hours of physician input. Lumiata’s recent validation studies on their technology show 95% concordance with Emergency Severity Index, and strong concordance with current physician practice.
The Patient Story: a Tool for the Exam Room
By layering an individual patient’s data over this graph, Snowflake creates a patient story that predicts likely outcomes and actionable next steps that physicans can verify. The platform gives patients a health score (color coded), rates their level of admission risk, and makes suggestions.
This is a powerful predictive tool, giving providers insight on patients based on a multiplicity of data sources, including other physician records and even sociodemographic data that may not be readily available to physicians. Such early detection can save patients and health systems thousands of dollars in the long run. Snowflake highlights gaps in care that identifies when a patient has missed tests or treatments commonly given to similar patients.
The patient story can also make patient interactions more meaningful. Providers need to be able to explain to patients the risks and consequences of not adopting healthy lifestyle changes. A computational model that predicts a specific outcome can have a weight in such discussions that even a doctor’s opinion may not. Or, more generally, the medical graph puts at a provider’s finger tips masses of information to show patients, which they would otherwise need to chase down in disparate digital depositories.
The Provider Story: Insights for Administrators
The provider view can also be used more immediately, looking at the appointments a doctor has scheduled for a particular day and displaying information about each of those patients. A quick glance at this data, such as the health scores, can help care teams estimate how long individual appointments will take and triage accordingly.
The Population Story: Managing the Health of Many
This view can also identify instances where patients are less likely to receive certain tests, or be diagnosed with a specific condition compared to the standard of care for those specific patients. Spotting these gaps in care can help organizations plan initiatives that reach into the community to meet unmet needs. Snowflake will calculate the financial benefit of closing these gaps. At San Mateo the Snowflake platform helped administrators spot an instance of mis-coding that was costing the medical center thousands of dollars.
Piloting the Platform
- After a three month implementation period, San Mateo Medical Center launched their pilot of Lumiata’s Snowflake platform in February at two of their sites: the Innovative Care Clinic and a satellite clinic in Coastside. They trained four physicians to use the platform.
- In their use of Snowflake, the SMMC team focused on watching the following metrics: missed diagnoses, missed labs, gaps in care, clinically-based financial projections, and excess utilization of labs, imaging and diagnostic tests.
What’s Next?
San Mateo Medical Center’s Snowflake pilot has been extended for an additional year. In that time SMMC is considering rolling the platform out to more of its clinics. Lumiata, on their end, is working to expand the scope of their medical graph, eventually hoping to allow it to make suggestions based on the most up to date clinical guidelines of care management and coordination, as well as take into account more socio-economic factors in its predictions. They are also considering using the platform with midlevel providers, such as nurses, who would lean more on the predictive suggestions of the platform.
Learn More
- The San Mateo Medical Center tests technology interventions as a hub in the Innovation Centers for the Safety Net. sanmateomedicalcenter.org
- The Innovation Centers for the Safety Net program is supported by the California HealthCare Foundation. chcf.org
- Learn more about Lumiata at their lumiata.com